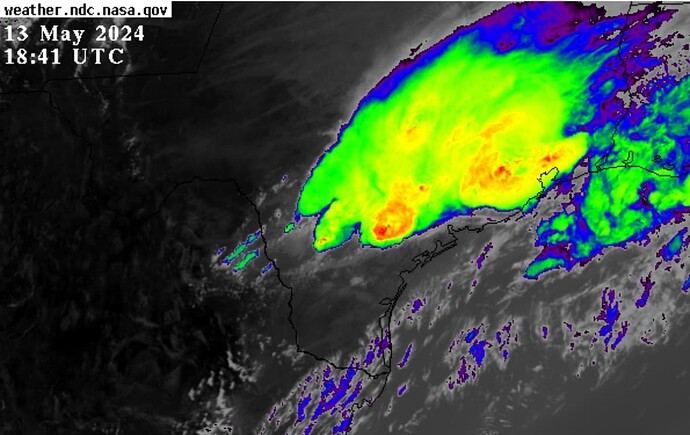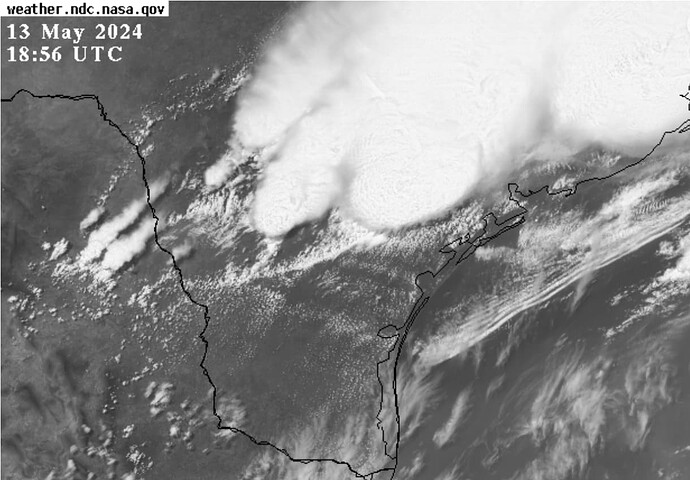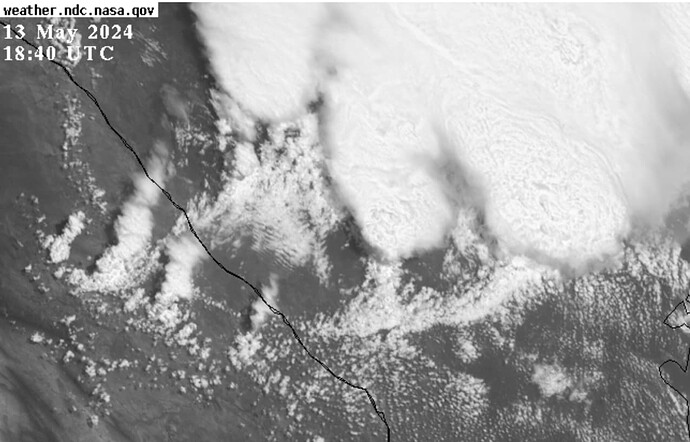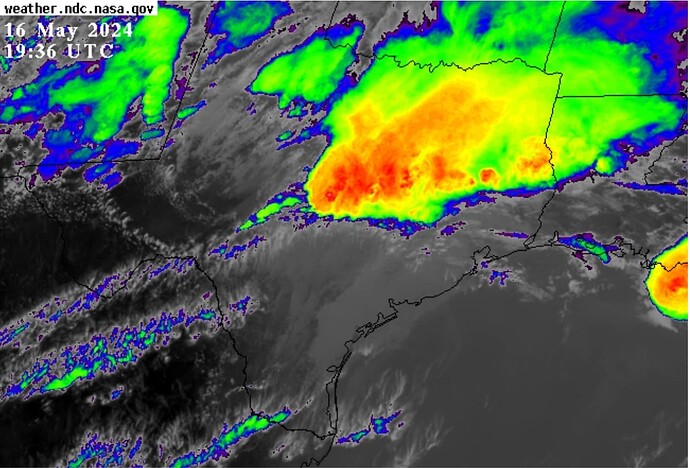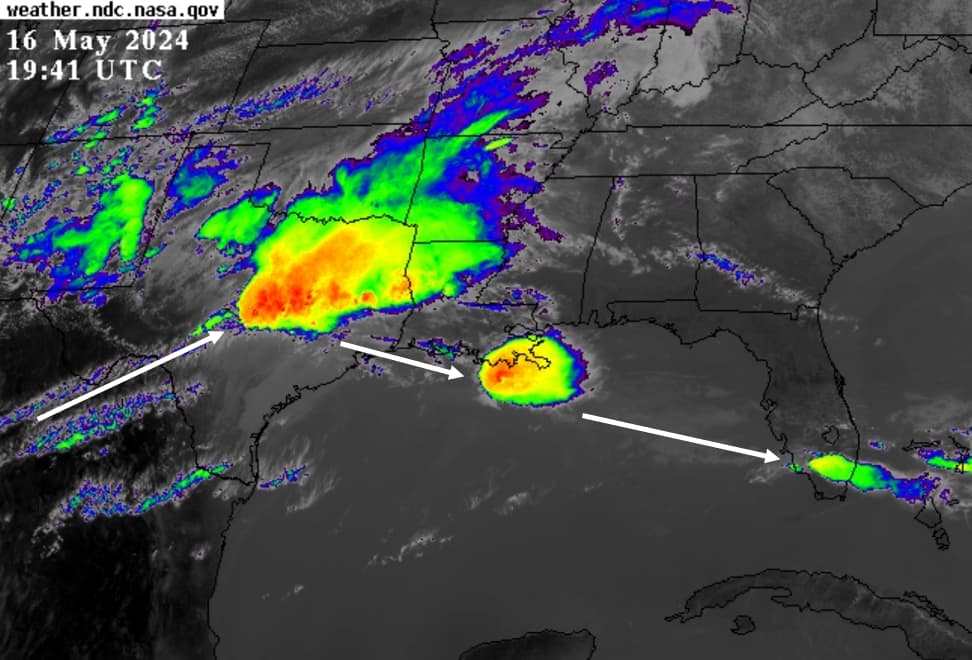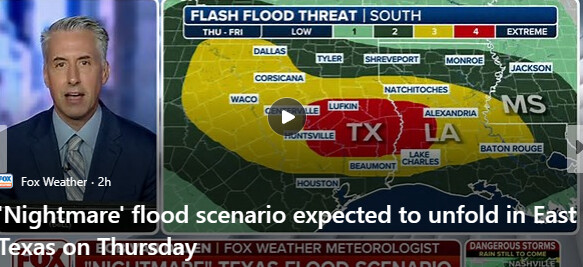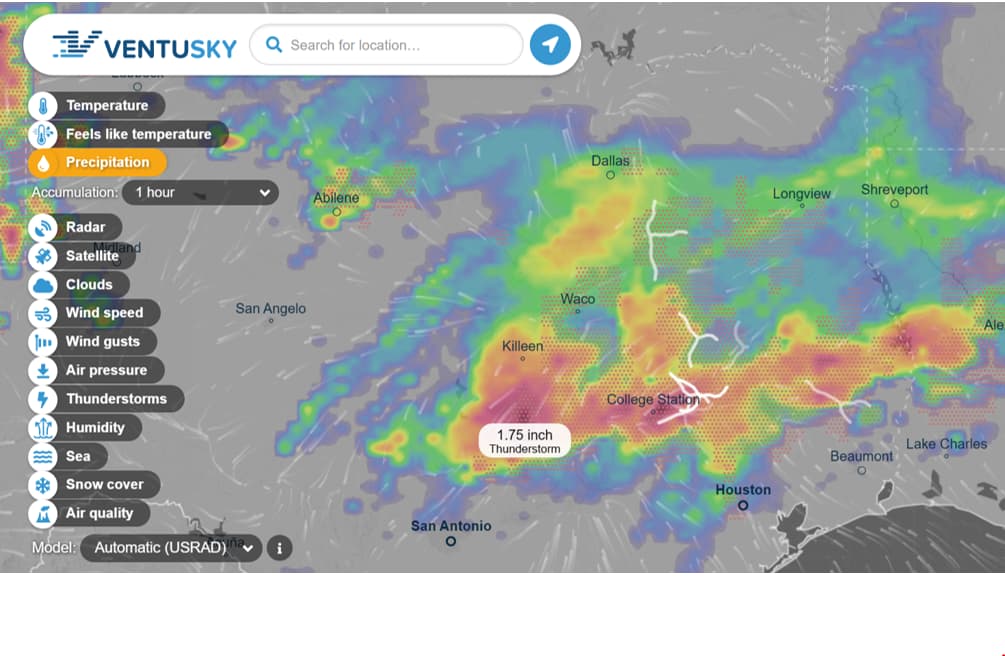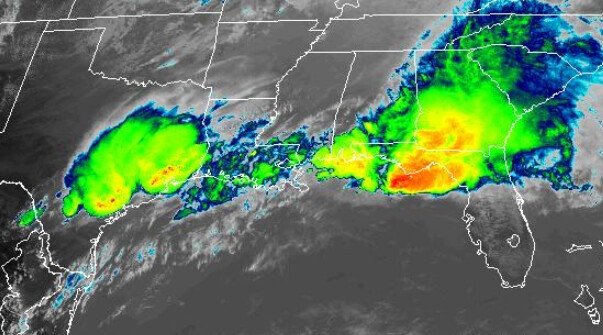
In the past I would have commented patterns observed in the various imagery. No more; I will just post for those who might want to observe on their own using the links below.
Note: The storms will move in time. The Lat and Lon parameters in the URL can be edited to reposition the image center and the Zoom parameter for in and out (set at 1, 2 or 4 only).
Where DOES the energy come from to boil up those (red=cold, high) cells in such a rapid, concentrated and synchronized manner? Reminds me of an old rock and roll refrain:
Line, line, everywhere a line
Blockin’ out sunshine, to poison humankind
Spray here, chem there, can’t you see the lines?
Or something like that.
.
NASA Band 13 (Latest 50-Images at 5-min Intervals)
.
NASA Band 02 (Latest 50-Images at 5-Min Intervals, Medium Zoom)
.
NASA Band 02 (50-Images at 10-min Intervals, Highest Zoom)

