Hundreds of Fires Across U.S. South Today: December 7, 2023

I started this new thread because of the sheer number of wildfires in the south today. Unprecedented for me, which says a lot for those familiar with my posts. I have not seen such a concentration of them across so broad an area, EV-ER.

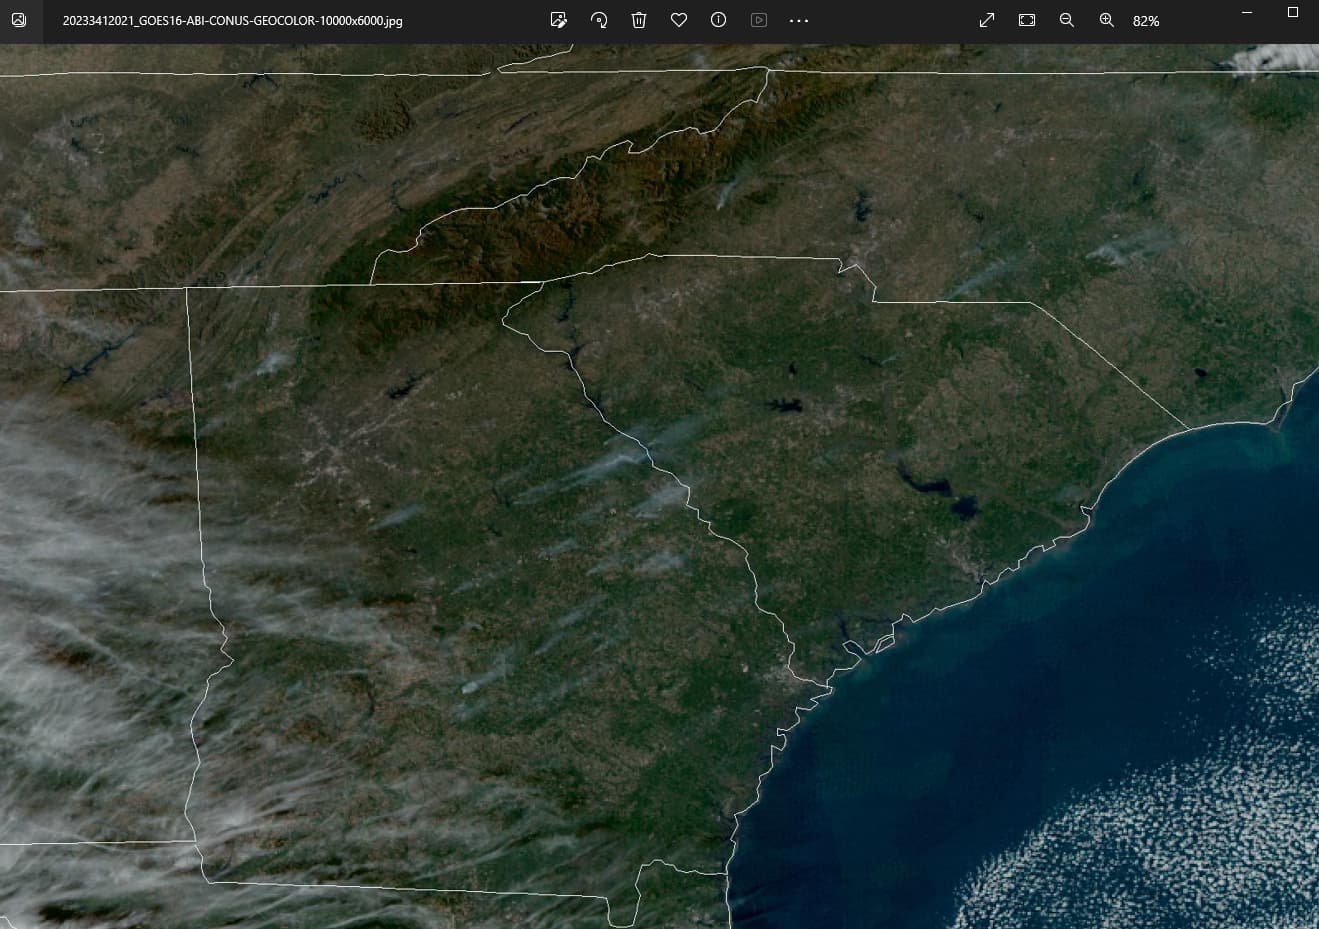
Eastern Texas. Louisiana, Mississippi, Alambama, Georgia and southern Florida have been hammered all afternoon. Because of the clouds, visible images above Georgia are clear and show the larger smoke plumes. There are also multiple fires in Tennessee, North Carolina, Arkansas and Oklahoma.

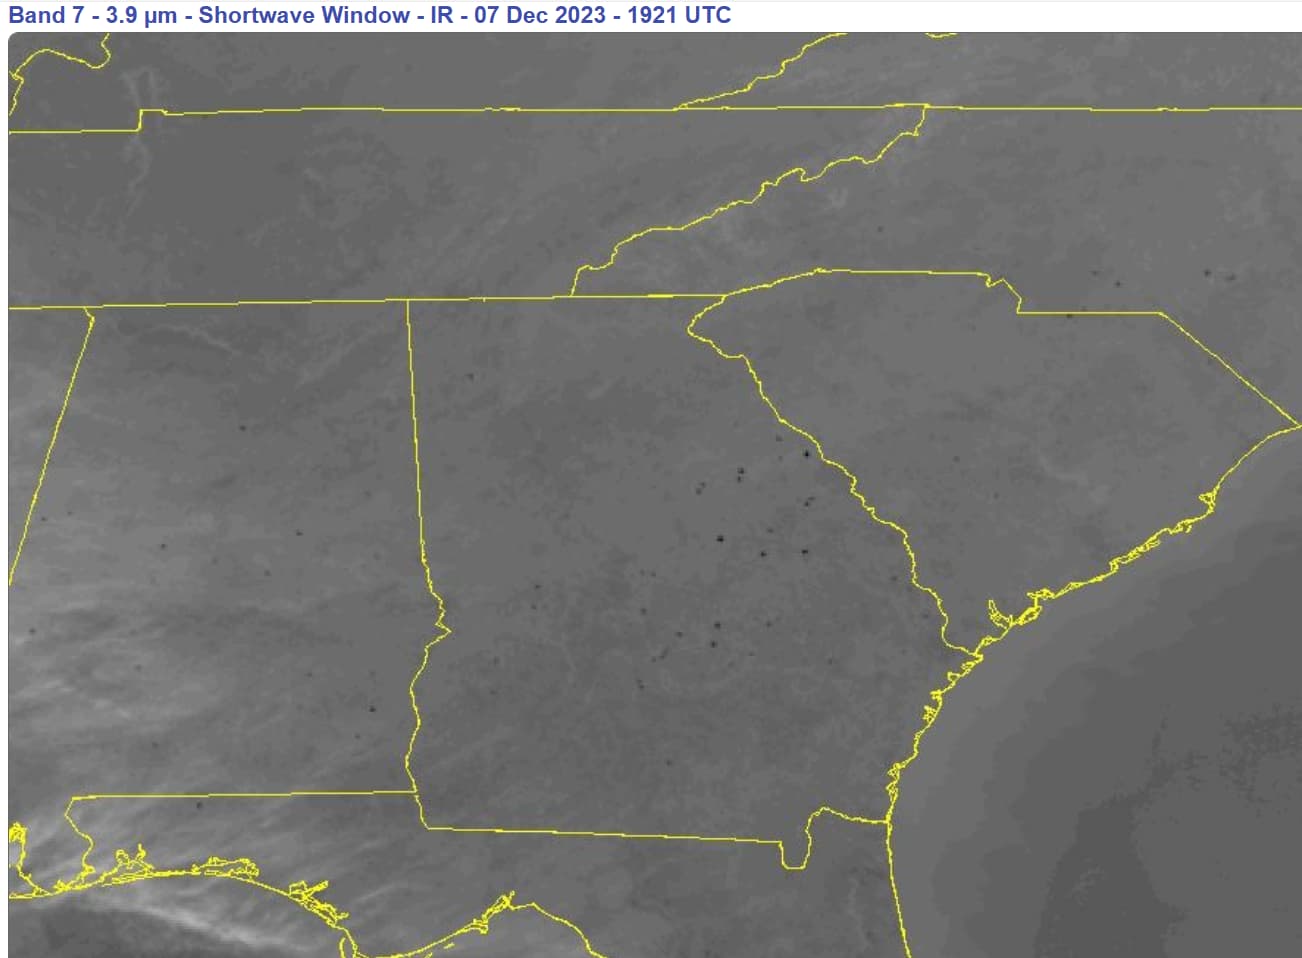
The casual reader will see a few black dots, yawn and move on. Click on the animations below and just watch. Still images only show a moment in time. Animations, if viewed this evening, show just how many hot spots there are. These aren’t lightning strikes.

Animated imagery tells a better story.
U.S. South Band 7 (infrared)
U.S. South GeoColor (visible)

High resolution still images are good, too.
U.S. Conus Dec 7, 2023 2021UTC GeoColor

4 Likes

I’m just wondering if they are using the smoke particles in ways that work with some kind of weather manipulation. What goes up must come down.

2 Likes

It was very windy yesterday. As I passed through Dripping Springs, a lit billboard indicated a burning ban due to the wind. This makes your thread particularly interesting from Central Texas viewpoint.

1 Like

I believe smoke generation was one objective of the 2023 Canadian and 2021 Californian wildfires, which somehow artificially perpetuated (I say with some sort of directed energy). The southern fires yesterday were “peppered” fires, my term for multiple small diameter fires that burn intensely for only a brief time (10-60 mins) in a particular geographic area, as opposed to the “hammered” fires which burn large tracts over a period of days or weeks.

I occasionally report peppered fires here on GDS, but as mentioned above, I have never seen so many black dots blinking on and off across so many states. Let’s hope they don’t need smoke as the Canadian fires were horrifically large.

Weather-wise, I see so much phenomena, too much to report here.

Windy here, too, but no warnings.

Imagery below is from NASA’s Fire Information for Resource Management System (FIRMS) NASA | LANCE | FIRMS The thick swaths of fires running north south in the eastern US look eerily like the fire pattern following intense lightning as seen in BC that triggered the 2 most recent bad fire seasons. In BC despite being well into winter weather there are still 150 fires burning from the fire season.

I am not sure how to interpret the red dots as I have not the time today to delve into it. What I can say is that they do not equate to infrared surface temperatures like NOAA GOES Band 7 imagery does.

Unlike the Canadian wildfires (pick a province) last summer, there are no plumes visible nor black dots for many of the red dot areas above, at least the ones free of cloud cover today (Dec 9, 2023).

One exception is east of Savannah, Georgia. On or near Ft Stewart

The attached link provides a poster format overview of FIRMS https://firms.modaps.eosdis.nasa.gov/content/posters/FIRMS_USFS_One_Pager_2022PrintRev.pdf
If you click on the scholar’s cap that appears when you first open FIRMS NASA | LANCE | FIRMS you can access learning materials. It is a very impressive tool for monitoring wildfires

Apologies , I can see how I confused you. I am now doing what I should have done in the first place , working through the FIRMS online training . Below are two FIRMS image of Georgia with comparable coverage to the image you posted to this thread earlier.

Caveats directly quoted from the NASA training manual as follows. "Although it may appear the whole world is on fire this is simply due to the relative density and symbol size of the data at this scale. When you zoom in, you can see that there is a lot of space between many individual hotspots. If zoomed in to much, it appears that the entire pixel is an active fire, however, the hot spot could be anywhere in the pixel. If zoomed in too much, it appears that the entire pixel is an active fire, however the hot spot could be anywhere in the pixel. If looking at VIIRS data, the fire could be anywhere in the 375 m squared pixel. If looking at MODIS data there could be only one hotspot anywhere in that 1 km squared piece of land that makes up the pixel, or there could be multiple fires in the 1 km squared pixel . It does not mean that the whole pixel is burning. "